| 1. Reducing weight click |
| 2. Unknown problem causing power fall click |
| 3. Effects of cold weather click |
| 4. BMW launch control (ASC) click |
| 5. Lightened flywheel click |
| 6. Full 1/8 run vs. backing off at half track click |
| 7. LGP vs. Petrol difference in performance click |
| 8. Brake test with and without ABS click |
| 9. Switching off a cylinder bank ( V8 -> inline 4 ) clikk |
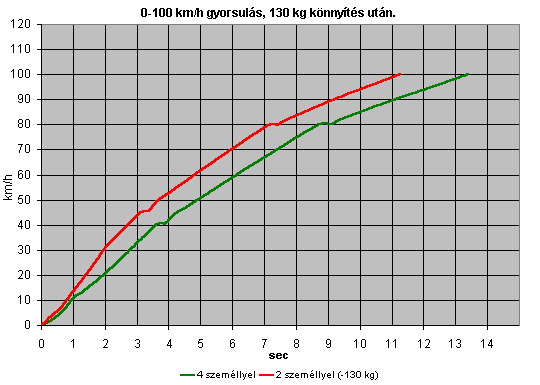
This speed-time chart shows the acceleration of an 1100 kg vehicle.
First we logged the
car with 4 passangers, this is the green line.
Then, we did it again with 2 passangers, that's the red line.
We selected the best of 3 runs of each config. Same road, same time.
The difference is
clear, 0-100 km/h time reduced by more than 2 seconds from
13.40 seconds to 11.26. It's
quite a difference, innit?
![]()
2. Unknown problem causing power fall (2001)
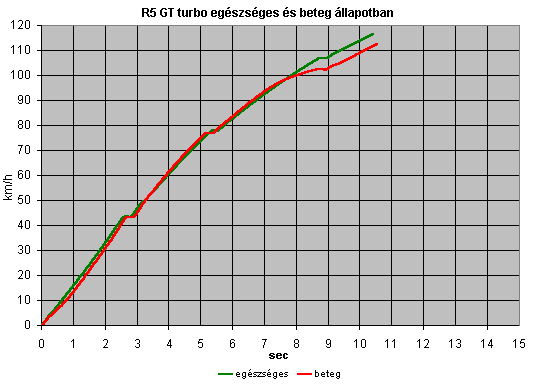
Again, it's a speed-time
chart, these are my Renualt 5's two 1/8 mile runs.
The green is an earlier run, where the car was working fine.
In the red run the car was loosing power in 3rd gear at high revs. (from around
5000 rpm)
As you can see, speed-wise the red run is ahead in the first 7 seconds, then
it
falls back spectacularly, I also shifted earlier than normal when I felt the
problem.
This is the only race I lost in 2001, and it was because of this problem. It was very close...
I don't know what
was causing it. Probably just crap fuel, I never noticed this later.
![]()
3. Effects of cold weather (2001)
With winter approaching,
I decided to test how much does the cold weather
helps my turbocharged, intercooled Renault 5 GT turbo.
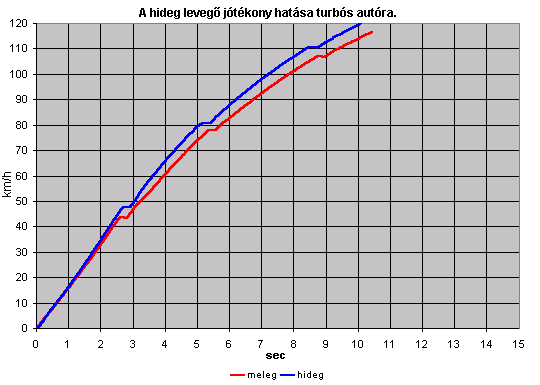
The first chart shows
speed vs. time over the usual 1/8 mile track.
The red line represents the
run I did on 2001 szeptember 13th at the Rabaring (cca. 16 °C),
the blue run I did on November 25th. (3 °C).
I did quite a few runs in November,
five in fact.
The difference between the best and the worst was 0.2 seconds.
(In order: 10.10 s, 10.22 s, 10.20 s, 10.08 s, 10.28 s)
In September my best was 10.43
seconds.
0-100 km/h in the race was 7.86, and in the cold I could manage 7.20 s.
But I revved the car higher
than in September, so this comparison is not exactly ideal.
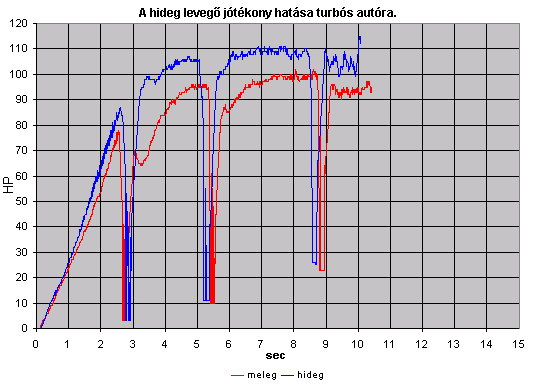
On the second chart
it's the same two run's wheel power vs. time chart.
![]()
4. BMW launch control (ASC) (2002)
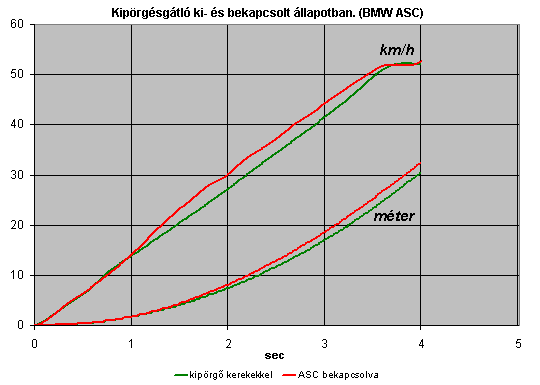
The test was conducted
with a BMW E46 320i.
The two runs were about 5 minutes apart, on the same, slightly wet tarmac.
It only shows the acceleration in 1st gear, as from 2nd gear the 320i is way
too powerless...
Whith ASC deactivated, the car was wheelspinning all the way.
The red line shows the speed vs. time and distance vs. time chart of the car
with ASC enabled.
It's clear to see that the red car starts to gain a speed advantage after the
1st second.
As it has a higher speed, it starts to gain distance as well, and while the
speed difference
reduces to almost zero at the 3.5 s point, it has already build up a leed of
about 2 meters.
So, ASC helps in the wet unless you're a pro...
![]()
|
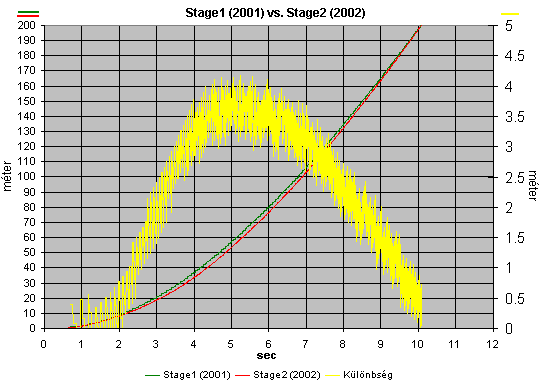
An interesting subject. The common understanding that
lightening the flywheel will make you go faster. It helps revs to pick
up faster, yes, but it was side effects as well. Well, my car was overhauled
during the Winter of 2001/2002 and a lightweight flywheel was put in.
I was eager to see the effect. But why did I collected this 4 meter deficit? Possibly if the engine would have been a bigger, naturally aspirated one, this problem wouldn't caused my loose time, but I've a tiny turbocharged 4 pot. |
![]()
6. Full 1/8 run vs. backing off at half track (2002)
|
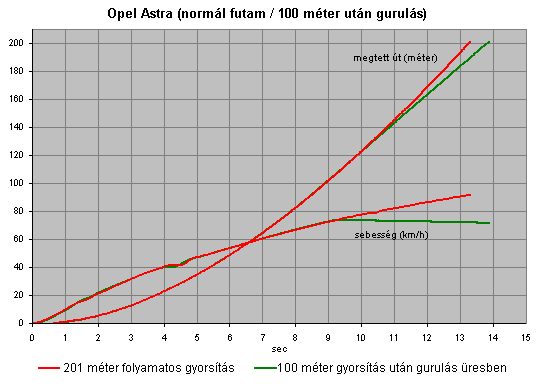
Another interesting
subject. Someone told me he did such a terrible ET because he ran out
of fuel midtrack. Ok, I thought, let's see how much time will you loose,
if you accelerate only for half track (100 meters = 330 feet) and then
just let the car roll freely... Well, for the test I've choosen the company
car I had at the time, a 60 hp Opel Astra 1.4 8v. As
a note I have to tell, it was quite hard to do two similar starts... :) |
![]()
7. LGP vs. Petrol difference in performance (2003)
|
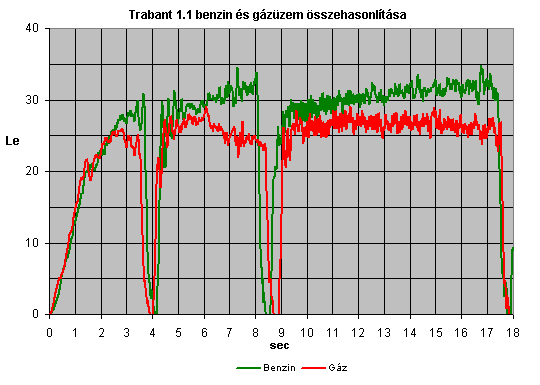
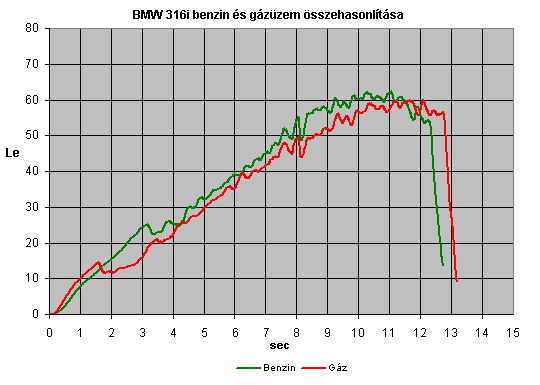
I was able to
test two different cars in Petrol and in LPG mode. |
|
The other car
was BMW E36 316i. |
![]()
8. Brake test with and without ABS.
|
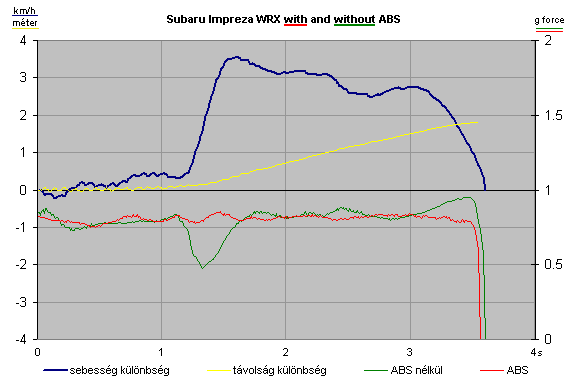
There were debates
recently on various forums whether ABS helps to reduce braking distances
as well, or just help to maintain control over the car during hard braking. The red line
shows the deceleration force with, and the green without ABS. The yellow
shows the distance between the two cars against time. |
|
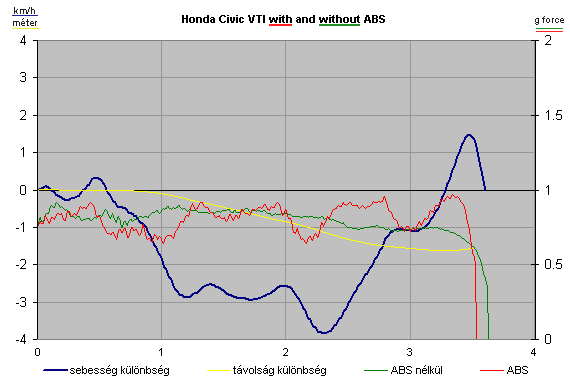
We logged
another car with and without ABS. It's a Honda Civic VTI. (photo)
It's quite easy to disable the ABS on a Civic. You have to pull away with the handbrake on (not fully obviously), and above a certain speed the computer throws up an error and disable the ABS. From this point it will stay disabled while the engine is running, regardless of the status of the handbrake. Once again, we tested in winter, dry tarmac, on 195/50R15 Pirelli Wintersport tires. We used the same strech of road, 5-10 minutes between the two tests. Well , there is quite a bit of surprise here, with ABS disengaged the braking distance is shorter! The braking starts even, but after half a second, the non ABS car finds extra traction and gains a speed difference of around 3 km/h, which stays on this level for more than a second. Then the speeds starts to equal, but this time the non ABS is more than 1.5 meters ahead! (5 feet) There's an interesting comeback of the ABS car starting from around the 2.5 second point. I think this is caused by a driver 'mistake' in the non ABS car. He simply didn't push the pedal hard enough. Anyway, it's proved, that the braking distance can be both shorter and longer with ABS, it depends on a lot of factors, there's no simple answer in real life. The blue and yellow line use the left scale. Negative values means the car without ABS has the advantage. E.g. at the 2 second point, it is travelling 3 km/h slower, and is behind the other car by around 0.9 meters. (3 feet) |
![]()
9. Swithing off a cylinder bank ( V8 -> inline4 )
|
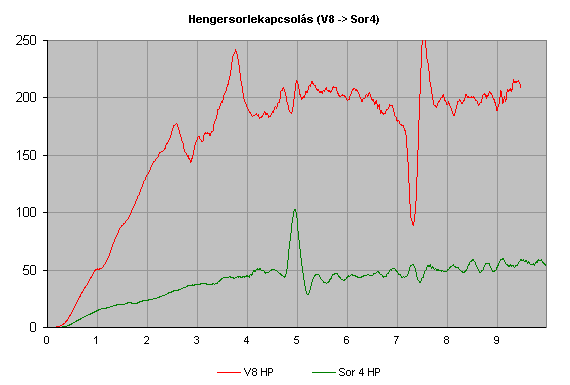
A friend had
some problems with his Chevy Corvette a few weeks ago, causing dramatical
power loss. It turned out it was caused by a blown fuse. Thinking simply,
we could think that half the cylinders will produce half the power. Far
from it. Internal losses and power required to suck in, compress the air,
etc... sap a lot of power. |

KISKUNLACHÁZA
OB ZÁZÓ FUTAM PART 1
Frissítve :
2010.09.11
